If you want to know how much resources your C# application consumes there is a very nice tool in Visual Studio for this purpose. It allows you to see how much CPU your program uses, amount of memory allocated for it, how much time your program running and many other useful things. Today I'll show how to build a performance test for your C# program in Visual Studio.
Ok, let's suppose we've created some C# application in Visual Studio. In order to run Performance Wizard go to main menu and click on Analyze and Launch Performance Wizard.
You'll see Performance Wizard first page where you can choose desired profiling method. Usually we want to know CPU consuming or Memory allocation. Choose your profiling method and click Next.
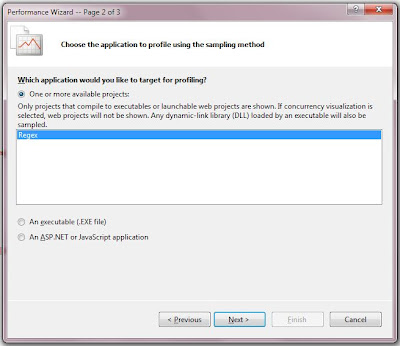
On the second page you can choose specific target project for profiling or even some external executable if you need it. Click Next.
On the third page, Performance Wizard asks you if you wish to launch profiling process after pressing Finish button. Check the check-box and press Finish.
Here what you'll see if you choose CPU Sampling:
If you choose .NET Memory Allocation this is what you'll see:
If click on Show Hot Lines you'll see detailed information about each method of your program:
Another useful feature is Trimmed Call Tree:


The Kettic Wizard Control resembles the installation wizards and help developers to divide a complicated operating process into various simple procedures which allows users of your application easily operate the application.
ReplyDelete